> ## Documentation Index
> Fetch the complete documentation index at: https://docs.insecureweb.com/llms.txt
> Use this file to discover all available pages before exploring further.
# Dashboards
> The UTMStack Dashboard is a comprehensive interface that displays a collection of visualizations and searches
 ## Overview
This one-stop hub offers critical insights into user activity, alerts, vulnerabilities, and network traffic within your organization. Equipped with a variety of visualization types, UTMStack streamlines security monitoring and analysis for a more secure network environment.
In this guide, we will walk through the Dashboard feature of UTMStack. Learn how to create custom visualizations from your log, event, and alarm data and add them to a personalized dashboard for efficient viewing and tracking. This guide covers the steps to filter and edit visualizations and using aggregation and segmentation options for a deeper understanding of the data.
## Getting Started
1. After logging into UTMStack, navigate to the **Dashboard** tab.
## Overview
This one-stop hub offers critical insights into user activity, alerts, vulnerabilities, and network traffic within your organization. Equipped with a variety of visualization types, UTMStack streamlines security monitoring and analysis for a more secure network environment.
In this guide, we will walk through the Dashboard feature of UTMStack. Learn how to create custom visualizations from your log, event, and alarm data and add them to a personalized dashboard for efficient viewing and tracking. This guide covers the steps to filter and edit visualizations and using aggregation and segmentation options for a deeper understanding of the data.
## Getting Started
1. After logging into UTMStack, navigate to the **Dashboard** tab.
 2. Click on **New Dashboard**
 ## Creating a New Dashboard
Upon clicking the New Dashboard option, a pop-up window appears on the right side of your screen. This window displays a list of pre-created visualizations, tailored based on the most common and useful visualizations requested by our users.
## Creating a New Dashboard
Upon clicking the New Dashboard option, a pop-up window appears on the right side of your screen. This window displays a list of pre-created visualizations, tailored based on the most common and useful visualizations requested by our users.
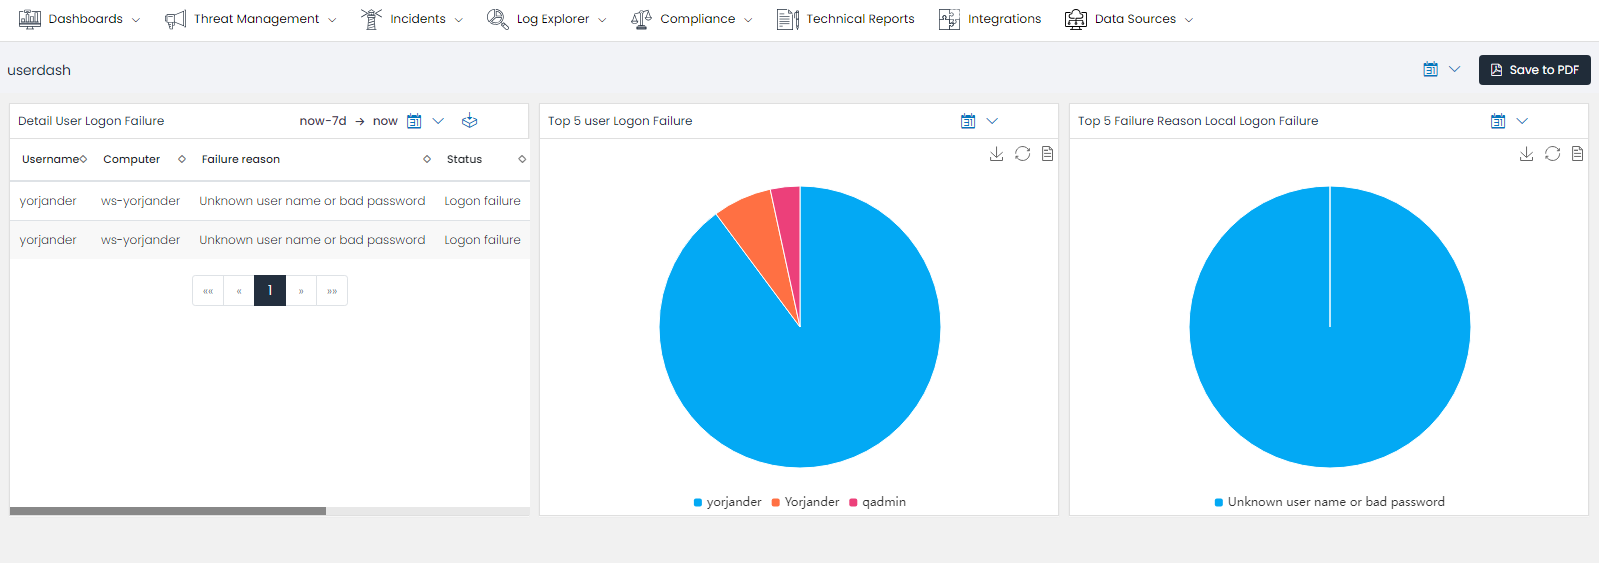
 You can now select your preferred visualization for the dashboard you wish to create by checking the respective checkboxes. For example, we are going to create a dashboard for manage the logon failure, using the **Top 5 User Logon Failures**, **Top 5 Failure Reason Local Logon Failure**s, and **Detail User Logon Failure** visualizations.
Now we click in the **+ Add visualizations** buttons in the botton of the windows.
You can now select your preferred visualization for the dashboard you wish to create by checking the respective checkboxes. For example, we are going to create a dashboard for manage the logon failure, using the **Top 5 User Logon Failures**, **Top 5 Failure Reason Local Logon Failure**s, and **Detail User Logon Failure** visualizations.
Now we click in the **+ Add visualizations** buttons in the botton of the windows.
 Upon closing the window, you'll be directed to the Dashboard view editor, featuring the selected visualizations.
 You can now add other visualizations, modify the size, position, and date range of your selected visualizations, or customize these visualizations to meet your specific requirements.
When you've finished configuring your dashboard, press the Save Dashboard button. You will need to provide a name for your dashboard and may also add a description (optional).
In the **Dashboard List**, you can use the search bar to quickly locate the dashboard you've just created.
You can now add other visualizations, modify the size, position, and date range of your selected visualizations, or customize these visualizations to meet your specific requirements.
When you've finished configuring your dashboard, press the Save Dashboard button. You will need to provide a name for your dashboard and may also add a description (optional).
In the **Dashboard List**, you can use the search bar to quickly locate the dashboard you've just created.
 Congratulations, your dashboard is now created and ready for use. You can click in the elements to get the data that is visualized in the chart.
You can use the **Save to PDF** button to export the dashboard visualizations to a PDF file.
Congratulations, your dashboard is now created and ready for use. You can click in the elements to get the data that is visualized in the chart.
You can use the **Save to PDF** button to export the dashboard visualizations to a PDF file.