

Custom filters allow you to parse, transform, and normalize logs from any data source, making them compatible with UTMStack’s correlation engine and analytics.
When to Use Custom Filters
Use custom filters when:- Your data source sends logs via syslog but doesn’t have a dedicated integration guide
- You need to parse custom log formats
- Standard filters don’t extract all the fields you need
- You’re integrating a proprietary or uncommon system
- You need to transform data before it reaches the correlation engine
Custom filters follow the same YAML-based format as standard filters. Review the Implementing Filters guide for syntax details.
Prerequisites
Before creating custom filters:1
Configure Data Source
Ensure your data source is sending logs to UTMStack via:
- 7014 TCP
- 7014 UDP
2
Understand Log Format
Collect sample logs from your data source to understand:
- Log structure (JSON, key-value, plain text)
- Field names and values
- Timestamp format
- Important fields to extract
3
Review Filter Types
Familiarize yourself with available filter step types:
json- Parse JSON logsgrok- Parse unstructured text with patternskv(key-value) - Parse key=value formatcast- Convert field typesrename- Rename fields- Others covered in the filter documentation
Step-by-Step: Creating a Custom Filter
Step 1: Open Data Processing
1
Navigate to Data Processing
From the UTMStack main interface, locate the Data Processing option in the right sidebar menu.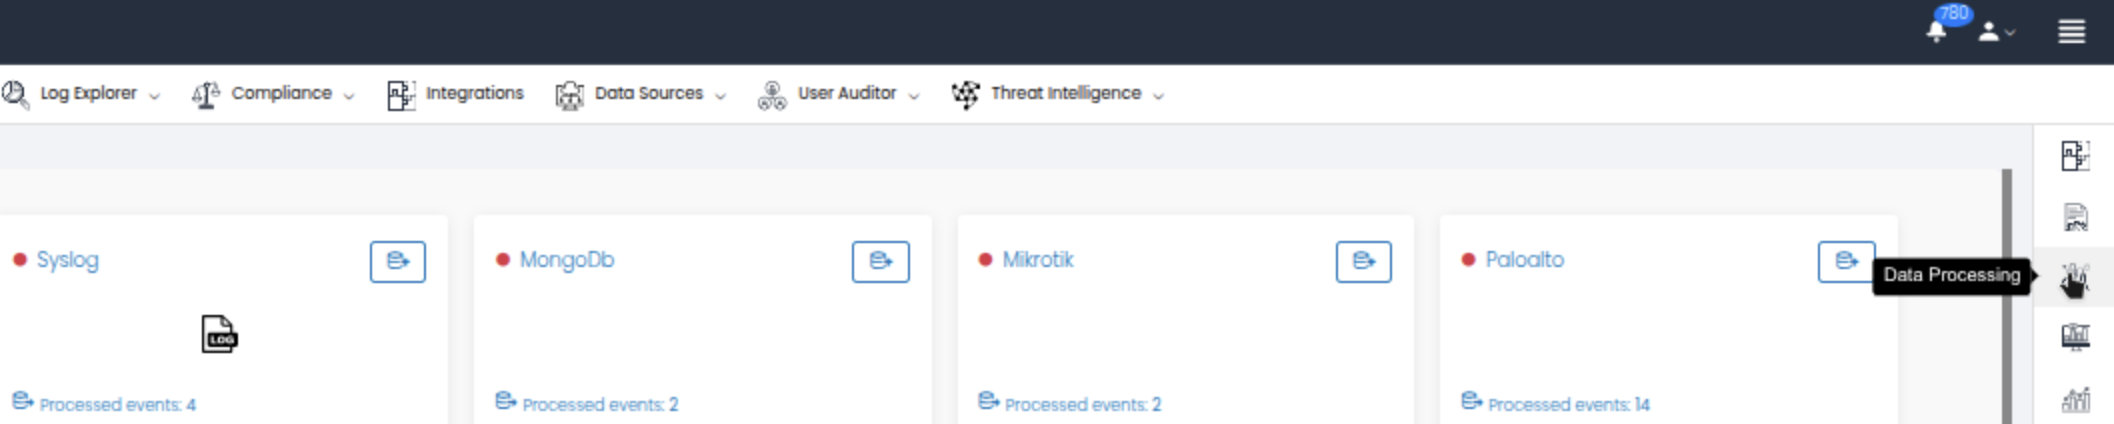
- Data source name (e.g., Syslog, MongoDB, Mikrotik, Paloalto)
- Status indicator (red dot = down, green = active)
- Processed events count - Number of logs processed
Step 2: Select Your Data Source
1
Choose the Data Source
Locate the data source you want to add a custom filter to. Common sources include:
- Syslog - Generic syslog receiver
- Windows agent - Windows event logs
- JSON input - Generic JSON receiver
- Any other configured source
2
Click the Pipeline Button
Click the pipeline button (📋) next to your data source to open the pipeline editor.A modal will appear showing the Pipeline [Source] detail.
Step 3: View Current Pipeline
The pipeline detail modal displays: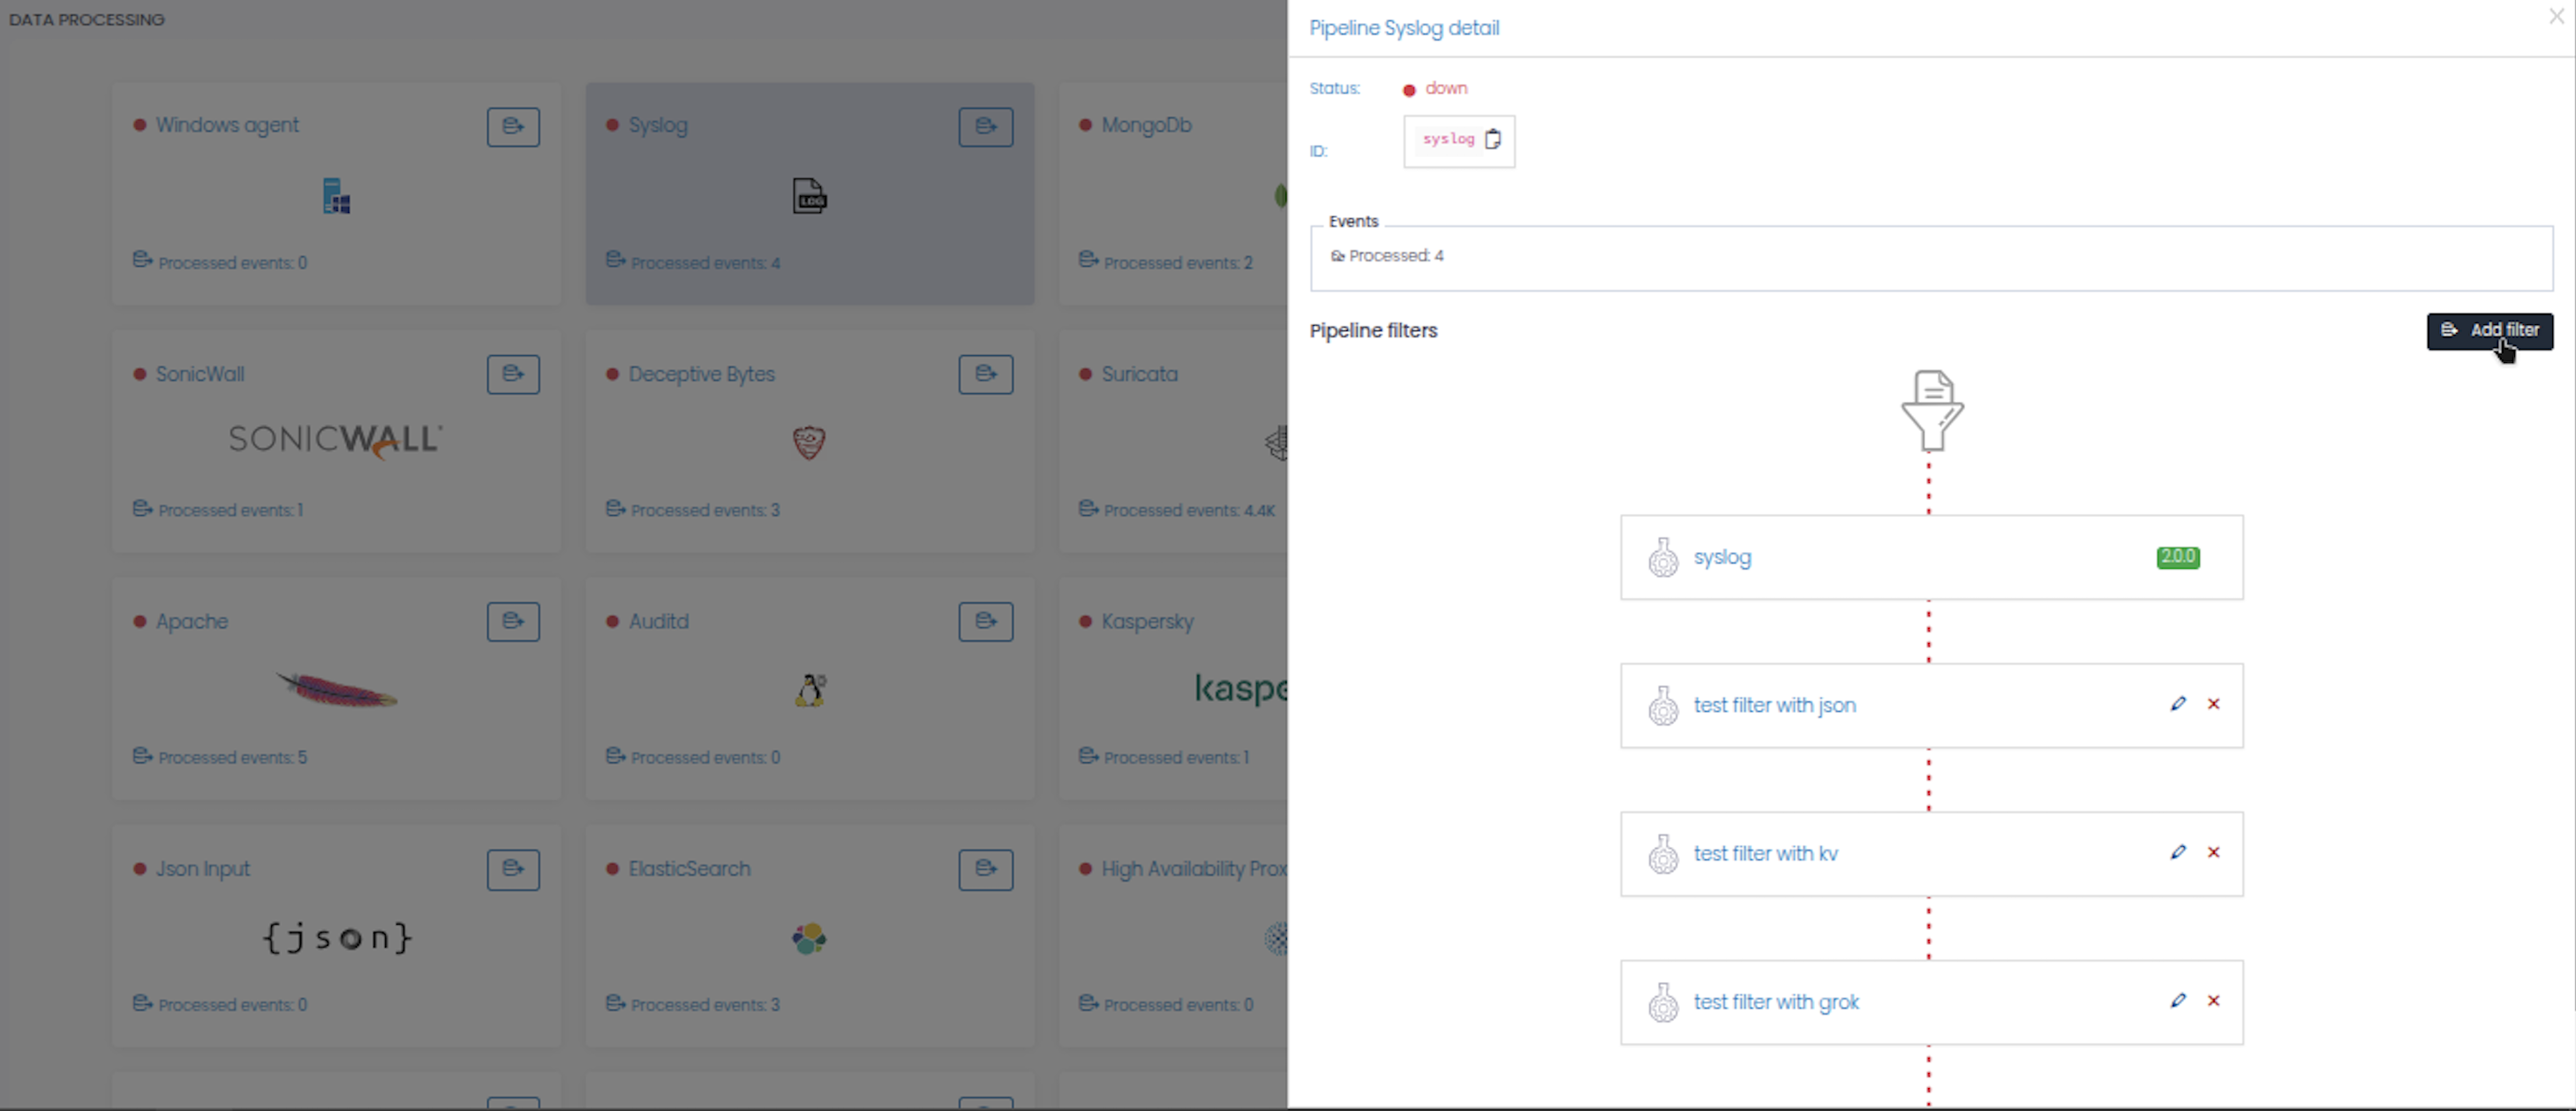
- Status: Current state (up/down) with status indicator
- ID: Unique identifier for the data source
- Events: Number of processed events
- Pipeline filters: List of existing filters in the processing pipeline
- Shows filters in order of execution (top to bottom)
- Each filter card displays:
- Filter icon
- Filter name
- Status badge (e.g., “FAIL” in red, “PASS” in green)
- Edit button (✏️)
- Delete button (✖)
- Filters are connected by dotted lines showing data flow
Step 4: Add New Filter
1
Click Add Filter
In the Pipeline filters section, click the Add filter button in the top right corner.
2
Open Log Filter Editor
The Log filter editor modal will appear with: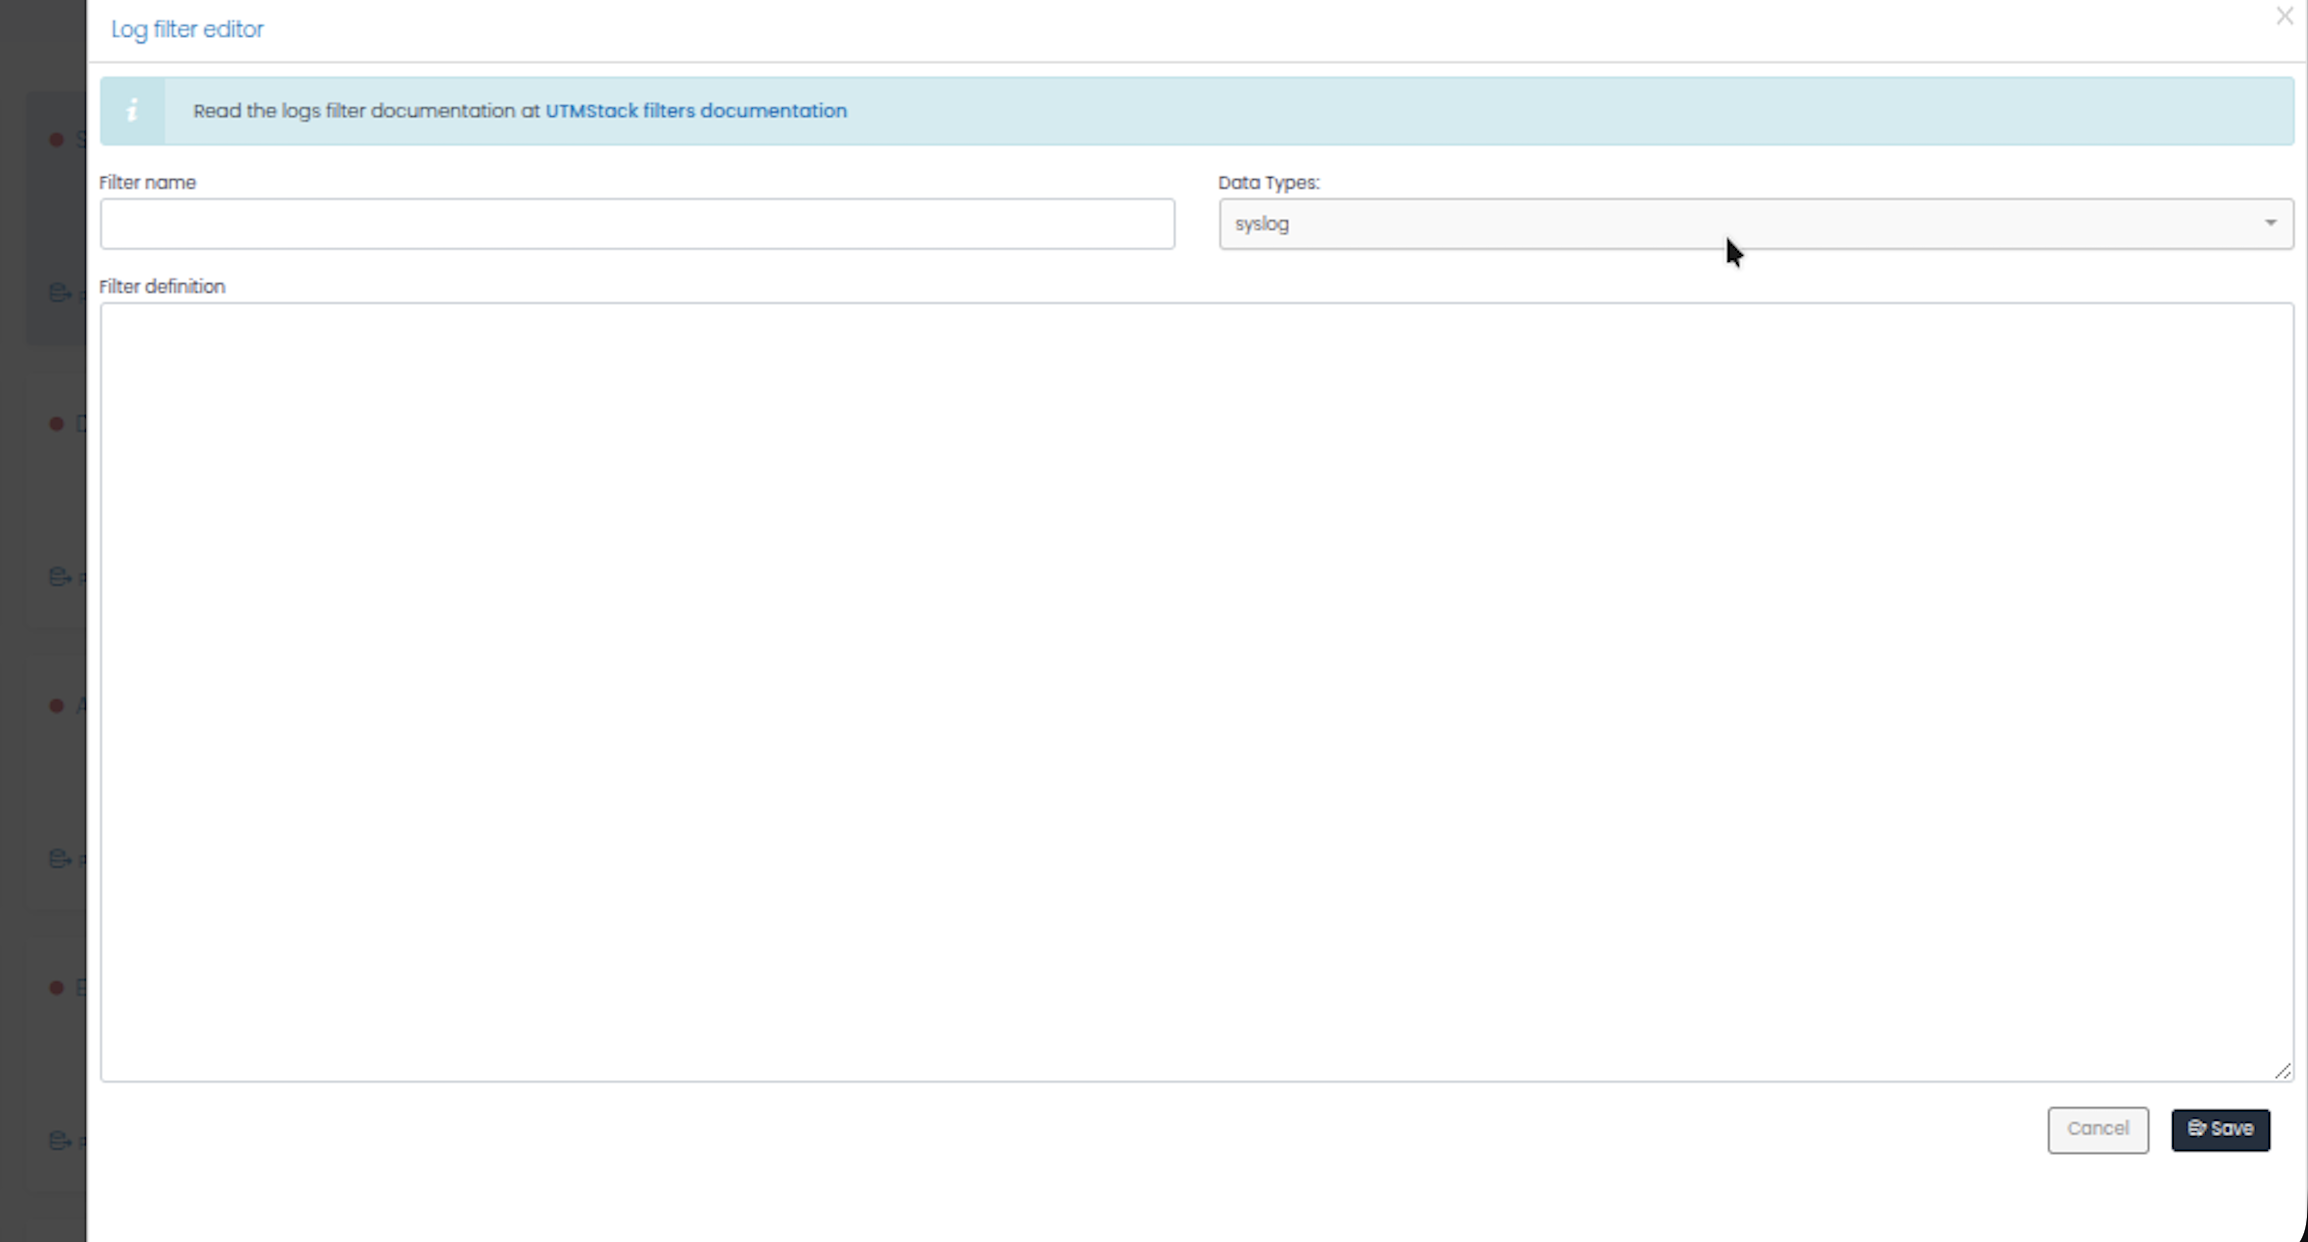
- Information banner: Link to filter documentation at “UTMStack filters documentation”
- Filter name: Text field for naming your filter
- Data Types: Dropdown menu to select the log type (e.g., syslog, json, etc.)
- Filter definition: Large text area for writing the YAML filter definition
- Cancel and Save buttons
Step 5: Write Your Custom Filter
Now you’ll write the filter definition using YAML syntax.Filter Structure
The complete filter structure includes the pipeline wrapper, dataTypes, and steps:- dataTypes: Array of data types this filter processes (e.g., syslog, json, windows)
- steps: Array of filter operations to perform in sequence
Example 1: Analyze JSON system logs
Example 2: Analyze key-value system records
Example 3: Complex multi-step filter
Example 4: Common filter patterns - Cisco ASA Syslog
Filter Best Practices
Use ECS Field Names
Use ECS Field Names
Normalize field names to the Elastic Common Schema (ECS) standard:Network Fields:
source.ip,destination.ipsource.port,destination.portnetwork.bytes,network.packetsnetwork.transport(tcp, udp, icmp)
user.name,user.domainuser.email
event.category(network, authentication, file, etc.)event.type(start, end, denied, allowed)event.outcome(success, failure)
process.name,process.pidprocess.command_line
Handle Parsing Errors Gracefully
Handle Parsing Errors Gracefully
Always account for logs that might not match your pattern:Options:
skip- Continue processing without this stepdrop- Discard the log entirelylog- Log the error but continue
Test with Real Logs
Test with Real Logs
Before deploying filters to production:
- Collect real log samples from your data source
- Test filter against various log formats and edge cases
- Check for logs with:
- Missing fields
- Different timestamp formats
- Special characters
- Unexpected values
- Verify performance with high log volumes
Use Conditions for Complex Logic
Use Conditions for Complex Logic
Handle different log formats from the same source:
Add Source Identification
Add Source Identification
Always tag logs with their source for easier filtering:
Preserve Original Message
Preserve Original Message
Keep the original log message for troubleshooting:Or use a dedicated field:
Troubleshooting
Filter shows FAIL status
Filter shows FAIL status
Cause: Syntax error or invalid YAMLSolution:
- Click the edit button (✏️) to reopen the filter
- Check YAML syntax:
- Proper indentation (2 spaces)
- Correct field names
- Valid filter step types
- Validate against the filter documentation
- Test with a simple filter first, then add complexity
No events being processed
No events being processed
Possible Causes:
- Data source not sending logs
- Firewall blocking syslog port
- Wrong port configuration
- Filter dropping all logs
- Verify data source is sending logs:
- Check firewall rules allow syslog traffic
- Test with netcat:
- Temporarily remove filters to see if logs arrive
Fields not extracted correctly
Fields not extracted correctly
Solution:
- Review sample logs to verify format matches your pattern
- Use simpler patterns first, then refine
- Test grok patterns at https://grokdebugger.com
- Check for special characters that need escaping
- Verify source field name in each filter step
Performance issues / slow processing
Performance issues / slow processing
Causes:
- Complex regex patterns
- Too many filter steps
- Inefficient grok patterns
- Simplify grok patterns - use specific patterns instead of
GREEDYDATA - Combine multiple rename operations into one step
- Remove unnecessary processing steps
- Consider using json parsing instead of grok when possible
- Add conditions to skip unnecessary processing
Timestamps incorrect or missing
Timestamps incorrect or missing
Solution:
- Verify the timestamp format string matches your logs exactly
- Common Go time formats:
- ISO8601:
2006-01-02T15:04:05Z07:00 - RFC3339:
2006-01-02T15:04:05Z07:00 - Custom:
2006-01-02 15:04:05
- ISO8601:
- Ensure timezone is included or use UTC
- Reformat timestamp explicitly:
Testing Your Filter
Method 1: Use Log Explorer
- Go to Log Explorer in UTMStack
- Filter by your data source:
log.source.type: "your-source" - Examine a few logs to verify:
- All expected fields are present
- Values are correct
- Types are appropriate (numbers not strings)
- Timestamps are accurate
Method 2: Export and Inspect
- In Data Processing, click the export button for your source
- Review the filter configuration
- Validate YAML syntax with an online validator
Method 3: Check Pipeline Status
- Monitor the pipeline detail modal
- Look for filter status indicators
- Check processed event counts increase
- Watch for error messages
Advanced Topics
Using Go Modules in Filters
Some filter types support Go module functions:Conditional Processing
Multi-Source Pipelines
For sources receiving multiple log formats:For assistance with custom filters, consult the UTMStack community or contact support at support@utmstack.com
Next Steps
Implementing Filters
Complete guide to filter syntax and step types
Implementing Rules
Create correlation rules to detect threats